Data & Analytics
Data Analytics & BI Dashboards
We build business intelligence (BI) dashboards in Power BI, Looker Studio and Metabase that bring your website, advertising, CRM and sales data into one clear view, so small business owners and managers can track the numbers that matter.
What is a BI dashboard?
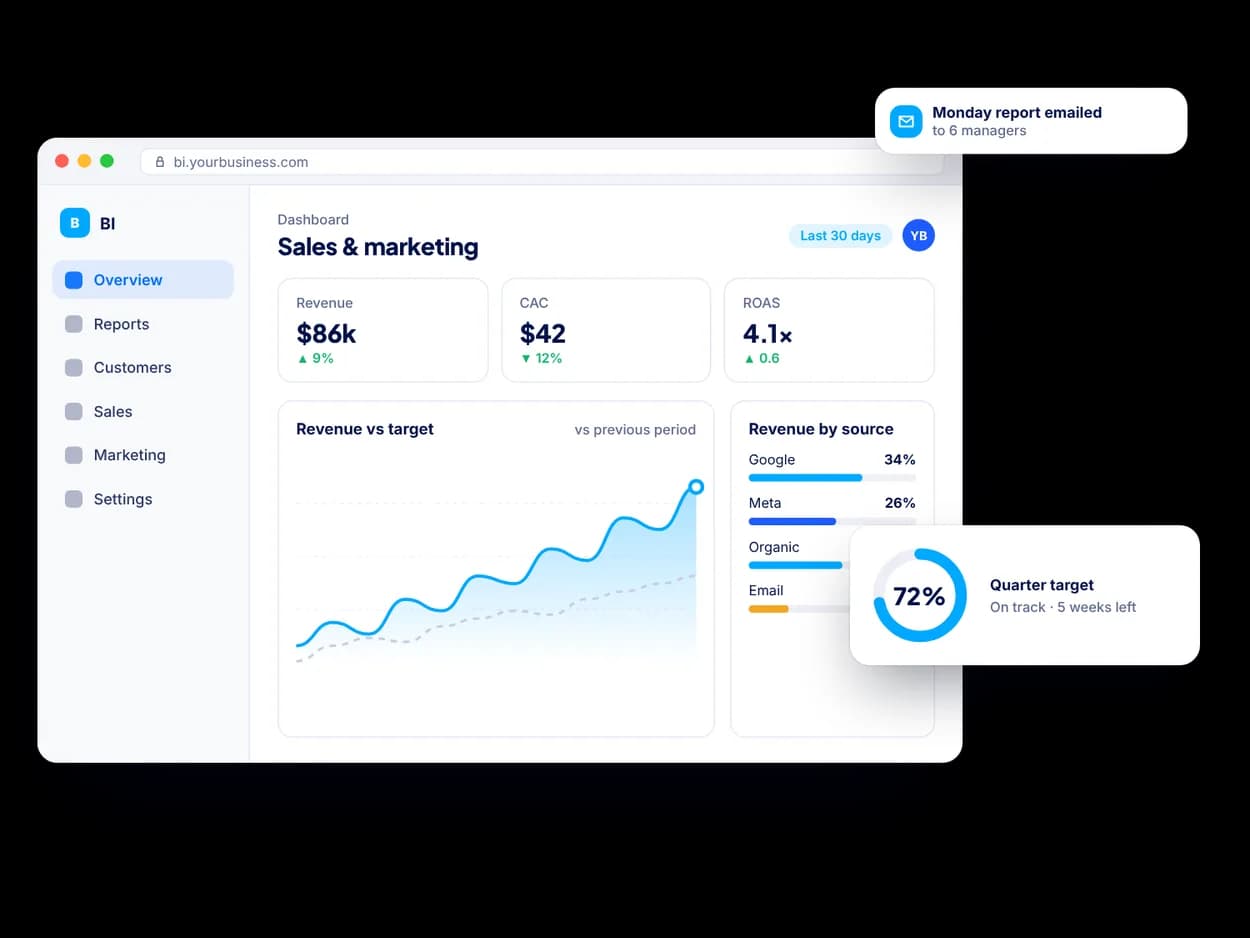
A business intelligence (BI) dashboard is a single screen that shows your key performance indicators (KPIs), updated automatically from the systems where the data lives. Instead of exporting spreadsheets from five tools every week, you open one dashboard and see sales, marketing and operations performance together.
What does our analytics service include?
- KPI design: agreeing which metrics matter, how they are calculated and who needs to see them.
- Data connections: GA4, Google Ads, Meta Ads, LinkedIn Ads, Search Console, CRM, e-commerce and accounting data.
- Dashboards: built in Power BI, Looker Studio or Metabase, depending on your tools and budget.
- Marketing attribution views: spend, leads and revenue by channel and campaign in one place.
- Scheduled reports: summaries sent by email or Slack on a regular schedule.
- Training: so your team can read, filter and extend the dashboards.
Which BI tool should you use?
- Looker Studio: free and well suited to marketing dashboards built on Google data.
- Power BI: strong for finance and operations reporting, especially for Microsoft 365 users.
- Metabase: open-source and easy for teams to explore data directly from a database.
How does the process work?
- Discovery: the questions you need answered and the decisions the dashboard should support.
- Data review: we check data sources, tracking quality and gaps.
- Prototype: a first dashboard on real data for your feedback.
- Build and automate: refresh schedules, access controls and documentation.
- Review: we refine the dashboard after your team has used it.
Why choose Digitexa AI for analytics?
- Dashboards designed around business decisions, not every metric available.
- Clear metric definitions, so everyone reads the numbers the same way.
- When data is spread across many systems, our data engineering team can build a warehouse underneath your dashboards.
- Support for teams in the US, UK, Middle East and India.
Ready to talk? Tell us about your project and a senior engineer will reply with next steps, questions and a suggested approach.
Data Analytics & BI Dashboards: FAQs
Can you combine GA4, ads and CRM data in one dashboard?
Yes. We connect Google Analytics 4, advertising platforms and your CRM so you can see spend, traffic, leads and revenue together. Where direct connectors are limited, we use a data connector service or a small data warehouse.
Should we use Power BI or Looker Studio?
Looker Studio is free and works well for marketing reporting on Google data. Power BI is stronger for complex financial and operational models and fits well if you already use Microsoft 365; we recommend based on your data sources and team.
What KPIs should a small business track?
Most small businesses track revenue, gross margin, leads, conversion rate, customer acquisition cost and repeat purchase or retention rate. The right set depends on your business model, and we help you choose a short list everyone understands.
How often do the dashboards update?
It depends on the data source and tool, but most dashboards refresh daily or several times a day. Some sources support near real-time data, which we set up where it is genuinely useful.